


12 minutes read report, 9 pages
How the forecasts did:
The continuation of the risk-on mode materialized, as forecasted. Both EURJPY and EURUSD calls hit bull’s-eye, AUDUSD is in the green, the long USDCAD position recorded an 80 pips rally before falling in the red. The USD trade was not triggered.
As I cannot name any more catalysts that would fuel the continuation of the risk-on mode, and as the government bond yields are unlikely to decrease any further, I am only advising for exit levels of the already opened trades.
Major events of last week:
- China: On Thursday a Chinese port blocked an Australian coal cargo. The coal ban is equal to 10% of Australia’s exports of the commodity to China and markets reacted with a significant fall of AUD & NZD. On Friday, the incident was downplayed. Meanwhile, the latest trade negotiations between the USA and China that took place in Washington between Liu He, Mnuchin and Lighthizer and ended with a Liu He- Trump meeting are pointing to an agreement being reached and to an extension of the upcoming deadline. The negotiations poured into the weekend. Apart from (a) the decrease of the Chinese trade surplus (b) structural changes on technology transfers and IP protection, (c) the way any deal will be enforceable, (d) the value of the CNY is included in the negotiations. The wording of the currency references has already been agreed by both parties.
- USA: 16 states challenged Trump’s National Emergency Declaration, as expected. The first round of the legal confrontation will take place in the Federal District Court in San Francisco.
- Turkey: As we are heading towards the March municipal elections, Turkey announced that, within October 2019, the S-400 Russian missiles (a $2.5bn project) will be deployed, despite NATO’s frustration. The USA has already decided to postpone the delivery of two F-35 jet fighters to Turkey. Turkey has committed buying 100 F-35.
- China-Taiwan: 10 months before January’s Presidential elections in Taiwan, the pro-China party that accepst the One China argumentation and the present ruling party, that regards China as being a military threat will contest.
- Russia-Ukraine: The Ukrainian Presidential elections are scheduled for March 31st . The 41 years old, comic actor Volodymyr Zelenskiy leads the polls (neither the current president, nor the opposition leader).
- UK: Several MP resignations from the Labor party.
- Cryptos: Total market cap at $135bn, +12.5% w/w, -83% from last year’s $821bn peak.
Major events of next week:
- USA-N.Korea 2nd summit is scheduled to happen in Vietnam
- An extension of the 90 day trade truce between the USA and China is very likely.
JPY
Exit the long EURJPY trades at 126.75

Strengths of JPY:
- GDP q/q growth rebounded from the negative territory.
- improving macro readings: GDP (yet, it is expected to decrease in 2019), inflation, unemployment, current account, average cash earnings, household spending, bank lending, housing starts,capital spending, industries activity, industrial production,
Weaknesses of JPY:
- deteriorating macro readings: retail sales,Services PMI, manufacturing PMI, M2, trade balance, monetary base, sentiment reading
Watch / New Releases:
- inflation, retail sales, housing starts
- Next Monetary Meeting on 15 March
AUD
Exit the long AUDUSD trades at 0.7213

Strengths:
- On Thursday a Chinese port halted Australian coal from being imported, sending AUD lower. Markets have mispriced the event as it was initially perceived as a Chinese retaliation move against the Australian Huawei ban. Further AUD upside is expected
- China’s impressive increase of new loans
- improving macro readings: GDP, trade balance, inflation, inflation expectations, unemployment, M1, AIG manufacturing index, household consumption recovered in 3Q18, wage price index, construction index, consumer’s sentiment, business confidence
Weaknesses:
- Westpac, one of the top four Australian banks, is expecting two rate cuts, in August and November 2019.
- The governor of the Central Bank (RBA) communicated ballanced propabilities for a rate hike or rate cut.
- Uncertainty on housing market (prices are expected to reach a -14% drop) and household consumption due to low income growth, high levels of debt and housing becoming a buyers market, remains. Yet consumer sentiment is improving.
- Elections on November
- deteriorating macro readings: retail sales, inflation gauge, job advertisements, manufacturing PMI, service PMI, home sales, home loans, current account,company operating profits, decreasing capital expenditure, building approvals, private capital expenditure, private sector credit
Watch / New Releases:
- Private capital expenditure, construction work done
- Next monetary meeting on 5 March.
CAD
I prefer long trades for USDCAD. Yet I am not offering a forecast as the current correlation with oil prices is very weak.

Strengths of CAD:
- improving macro readings: employment change, inflation, current account, building permits, corporate profits, wholesale sales, retail sales (latest release was higher but it is still negative)
Weakness of CAD:
- Another resignation from Canada’s Cabinet. This time, it was the Minister of Veterans Affairs (former Minister of Justice). She resigned when it was revealed that she was forced by the Prime Minister to help the big contractor, SNC-Lavalin, avoid criminal prosecution while she was serving as a Minister of Justice.
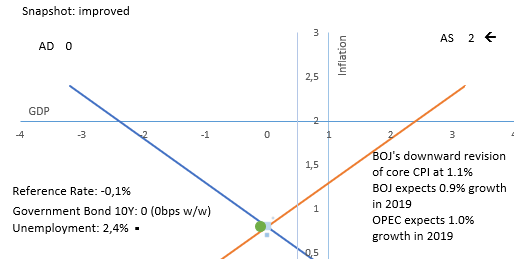
- OPEC’s February report on the oil market, included another downward revision of the global oil demand growth. (1.29Mb/day increase, was revised to 1.24Mb/day increase) so that by the end of 2019 World would consume the round number of 100MB/day.
- deteriorating macro readings: GDP, unemployment, trade balance, Manufacturing PMI, manufacturing sales, Ivey PMI, foreign securities purchases
Watch / New Releases:
- inflation, corporate profits, GDP m/m, manufacturing PMI
- Next Monetary meeting on March 4.The latest macro releases do not favor the rate hike scenario I was supporting during the previous weeks.
USD
Short USDindex at 0.9736 (same as previous week)

Strengths of USD – Risk off points:
- deteriorating macro readings: GDP, current account, retail sales, Manufacturing PMI, Non-manufacturing PMI, industrial production, consumer credit, optimism,consumer confidence, consumer credit, vehicles sales
Weaknesses of USD -Risk on points
- The possibility of a new government shutdown is removed and trade talks with China are heading to a positive direction.
- FED changed it’s communication and is currently on hold as there is zero inflationary pressure. Both Inflation expectations and capacity utilization rates are falling. New readings are expected this week.
- Improving macro readings: trade balance, services PMI, durable goods orders, capacity utilization rate, consumer sentiment, construction spending, wholesale inventories moving lower, the decreasing business inventories is positive, housing market
Watch / New Releases:
- Wholesale inventories, consumer confidence, GDP q/q, Personal Consumption Expediture, Manufacturing PMI and Vehicles sales
- next Monetary Meeting on 20 March. No hike is expected.
EUR
Long EURUSD at 1.1178

Strengths of EURUSD:
- Markets are pricing rising political risk ahead of Spain’s snap elections on April 28 and the European Parliament Elections in May. My conviction is that the results of both elections will eventually trigger a EUR rally, the same way that EUR rallied following the French elections of 2017. The European Barometer survey reveals a significant rise of the positive views of Europeans, towards the EUR currency.
- improving macro readings: M3, trade balance, current account, unemployment, Services PMI, German GDP, German Trade balance, wage growth, industrial production, economic sentiment, private loans
Weaknesses of EURUSD:
- downward revisions of expected GDP growth from European commission. 1.3% EU growth from 1.9% expected in November, 0.2% Italian growth from 1.2%. Inflation revised to 1.4% from 1.8%
- markets are projecting at least another 2-3 years of re-investment of maturing securities and the first rate hike in 2020
- Both the German and the Italian Economy have reported negative GDP q/q growth. Yet Germany managed to avoid the technical recession as the latest published GDP q/q growth was 0.0%
- Worsening relations between France and Italy over the ‘gilets jaunes’ and immigration
- deteriorating macro readings: GDP, inflation, PPI, retail sales, Manufacturing PMI (bellow 50), investor confidence,consumer confidence, German factory orders, German industrial production, German retail sales
Watch / New Releases:
- M3, Private loans, unemployment, inflation
- Next Monetary Meeting on 7 March.
GBP
No forecasts for GBP
We are only 5 weeks away from the deadline of Article 50 and the most probable scenario is the extension of the deadline, new elections and/or a new referendum.
9 MPs resigned from the Labor Party. Judging from their published arguments, that is good news in my book.
Meanwhile Ireland is getting ready for a hard, no-deal Brexit

Strengths:
- improving macro releases: unemployment, retail sales, Manufacturing production, industrial order expectations, M4,home prices, average earnings and wages, decreased inflation, lending to individuals, trade balance
Weaknesses:
- GDP growth has slowed further. Some inflationary pressure was expected by BOE that would be responded with limited rate hikes, but inflation has already fallen below the 2.0% target.
- the ongoing uncertainty is already evident at macro readings, and could drag on until July. Investments have been hit the most. Latest GDP m/m reading was negative.
- deteriorating macro releases: GDP, Service PMI, consumer’s confidence, current account, Business Investments, Construction PMI, construction output, Manufacturing PMI, Industrial production
Watch / New Releases:
- Inflation report hearing, consumer confidence, manufacturing PMI, Lending to individuals, M4
- Next monetary meeting on 21 March
Appendix
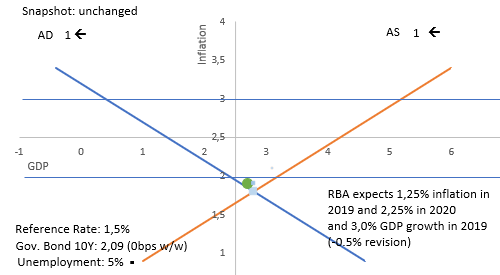
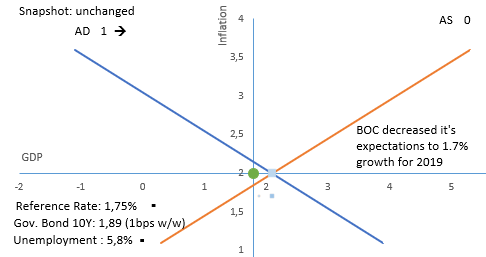
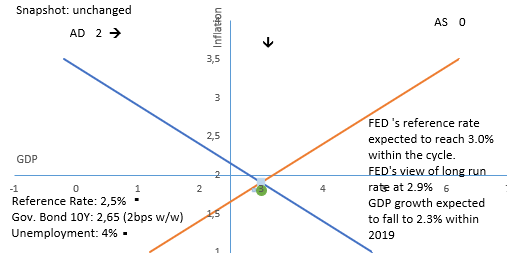
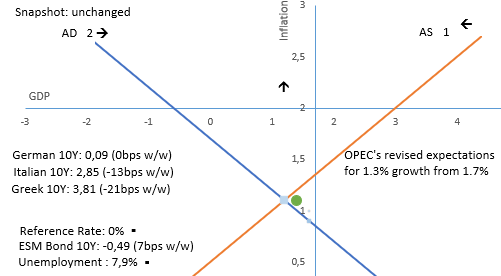
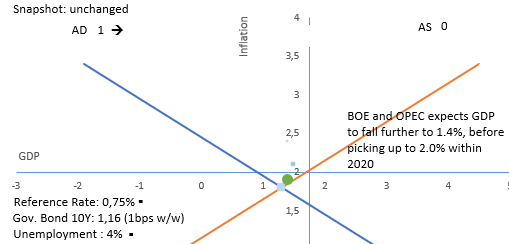
The blue line represents the aggregate demand curve of the economy and red line represents the aggregate supply curve.
The lines intersect at the latest published GDP growth and latest published inflation rate. The blue dots represent past snapshots of the economy (ie past GPD growth and past inflation). The green dot represents the estimated GDP growth and inflation. In the above example, the estimated economic equilibrium is the same with the current equilibrium.
The horizontal line is the targeted level of inflation so that long term growth is achieved. The vertical line represents long term potential growth. In the above example, the potential growth is within the range of 0.5% and1.0%. Targeted inflation is 2%. The economy is growing below its potential and with lower inflation.
The arrows represent the effects of the latest macro releases.
Disclaimer
Issued by Labis Michalopoulos, CFA
Redistribution is allowed as long as the author and his contact details are referenced.
The snapshot section of each page, contains the latest published figure of major macro releases. It is not a result of now-casting models that would potentially have revealed the effects of current US government shutdown. The coloring of bond yields depends on more than one equation/rule.
My net returns are published in real time at www.forexfactory.com/dxmix I was experiencing an Annual Sharpe Ratio of 1.73 for over 45 months (montly Sharpe ratio above 0.5) . On 24 August, I mistakenly ordered to open a position 10 times bigger that I am used to. My equity level is currently back on track, but my statistics are no longer impressive. My 48 months monthly Sharpe Ratio, that includes the leveraged AUDUSD trade, now stands at 0.30, equal to 1.03 Annual Sharpe Ratio.
This material is for Qualified Investors and Professional Clients only and should not be relied upon by any other persons.The degree of confidence in our forecasts gets smaller, the more knowledge we posses for each security.
Past performance or past accurate forecasts is not a guide to future performance and the accuracy of future forecasts and should not be the sole factor of consideration. All financial investments involve an element of risk. Levels and basis of taxation may change from time to time.
This report is for information purposes only and does not constitute an offer or invitation to anyone to invest or trade and has not been prepared in connection with any such offer.
Any research in this document has been produced by Labis Michalopoulos, CFA for his own purpose. The views expressed do not constitute investment or any other advice and are subject to change. The author has an interest in the currency pairs, indexes and any other security disclosed in this report as he is an active trader.
Reliance upon information in this material is at the sole discretion of the reader.