


The Central Banker’s week
US drone downed in Iran – Central Banker ready to provide extra accomodation – Protests at Hong Kong continue
12 minutes read report, 8 pages
To help speed reading blue is used for new arguments, forecasts are underlined and found at the beginning of each page, hyperlinks are marked.
How the forecasts did:
Despite the fact that my readers have not received last week’s report, they were forewarned to turn their attention to an upcoming rate cut since the 8th of June report. We are no longer inside the tightening cycle. Markets are currently pricing in a 31st of July FED rate cut and I have been directly pointing to that scenario at the title of the 70th issue of this report.
Eventually, that has been the most crucial development of the previous week and shorting USDindex at 97.11$, as it was proposed at the 10th of June report, proved to be a very rewarding entry point.
The long EURUSD trade at 1.1171 was missed by 9 pips, shorting the GBPUSD was not triggered, going long EURJPY is 22pips in the green and going long AUDUSD is 4 pips in the red.
I keep favoring the short USD, long equities-oil–EUR–AUD-CAD scenario for 2H2019.
Major events of last week:
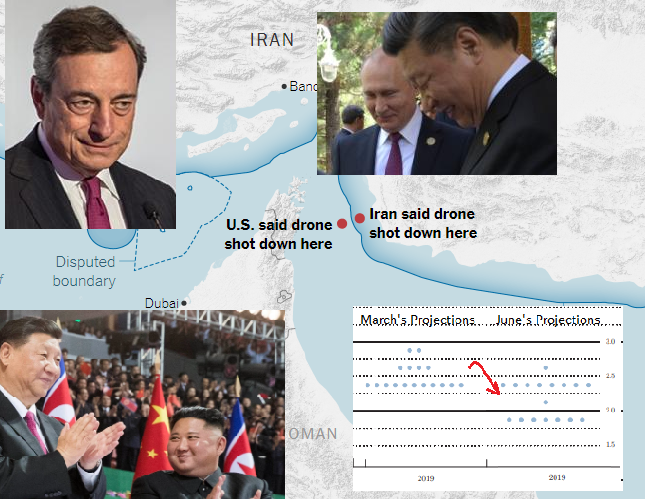
- Geopolitics: (a) A US, unmaned, $130mn, RQ-4 drone was downed in Iran. Retaliatory strikes by the USA were approved but then pulled back at the last minute. It seems that noone intends to start a war. Nevertheless, 1000 troops are set to be sent to the Middle East in top of the additional 1500 troops sent during the last month. Russia and China warned the USA to not open the Pandora’s box by sending more troops to the Middle East(b) The US Senate blocked the sale of weapons to the Saudis
- Protests: (a) Hong Kong protests against the new extradiction law to China, have restarted. (b) Riots in Georgia calling for government resignation.
- USA-China: President Trump reveiled that he had a constructive telephone conversation with President Xi and negotiators from both parties started preparing the upcoming Trump-Xi meeting at the upcoming G20 summit.
- China-Russia: For the second time in just under a week, President Xi and President Putin met
- China-N. Korea: For the first time since 2005, North Korea has been visited by the Chinese President. The visit was less than 24 hours long and both parties most propably use it to get some leverage at their relations with the USA.
- Turkey: The EU threatened to impose sanctions on Turkey if it continues its illegal drilling in Cyprus.
- Markets: S&P500 near its historic highs, US 10y Government bonds almost dropped bellow 2%, French 10 Y bonds tested the negative territory, as extra accommodation is underway.
- Cryptos: The market cap jumped to $325bn, +26% in 2 weeks, -60% from last year’s $821bn peak. The week has been marked by the introduction of Libra, Facebook’s crypto, stable coin.
Major events of next week:
- Tommorrow’s municipal elections in Istanbul Turkey.
- OPEC and OPEC+ summit in Vienna.
- G-20 summit on Friday and Saturday.
JPY
Long EURJPY at 121.65
Strengths of JPY:
- improving macro readings: GDP (yet, it is expected to decrease in 2019), inflation, unemployment, current account, M2, bank lending, monetary base, average cash earnings (decreasing with a lower rate), capital spending, insdustrial production, industries activity (turned possitive), machine orders, economy watchers sentiment, consumer sentiment
Weaknesses of JPY:
- economy needs to overcome the upcoming consumption tax hike, scheduled to be imposed on October.
- deteriorating macro readings: retail sales, household spending, trade balance, manufacturing PMI (below 50), Services PMI, consumer confidence, PPI(prices sold to corporations), housing starts
Watch / New Releases:
-
retail sales, unemployment, industrial production.
-
next Monetary Meeting of the Bank of Japan on 30 July.
AUD
Keep the long AUDUSD trades until 0.7111
Strengths:
- RBA cut rates to boost the labor market and household consumption. Markets approved the monetary accommodating decision and AUD strengthened. The RBA is confident on a 2H19 rebound.
- Newly elected government.
- improving macro readings: GDP, current account, M1, service PMI, Manufacturing PMI, AIG manufacturing index, AIG services index, construction work done (but is still in a negative territory), household consumption, wage price index, business confidence
Weaknesses:
- the manufacturing PMI of China dropped bellow the 50 threshold again.
- Housing market and Prices not rising, credit not increasing
- deteriorating macro readings: inflation gauge, job advertisements, retail sales, trade balance, home loans, private sector credit, home sales, building approvals, AIG construction index, HPI (home prices), company operating profits, decreasing capital expenditure, private capital expediture, consumer’s sentiment
Watch / New Releases:
-
no market moving release is expected
-
Next monetary meeting of the RBA on July 2.
CAD
No forecast for USDCAD
Strengths of CAD:
- inflation increased contrary to the zero inflationary pressure found at the rest of the developed economies.
- the ongoing geopolitical tensions in the Persian gulf
- tariffs for the Canadian steel and aluminum imported to the USA have been lifted. Canada has ratified the USMCA deal that succeed NAFTA.
- housing market is expected to pick up in 2H19, following the stabilization in Toronto and Vancouver. BOC continues to be optimistic about a 2H19 rebound.
- improving macro readings: GDP, unemployment, labor productivity, inflation, Ivey PMI, wholesale sales, manufacturing sales, employment change, trade balance, building permits, corporate profits
Weakness of CAD:
- significant downward revision of the expected global oil demand growth by the OPEC.
- fiscal policy expected to have a -0.2% net effect in GDP growth.
- weak government until the upcoming elections on October. This could be traslated to no rate hike until the elections, despite the rising inflation.
- deteriorating macro readings: current acount, wholesale sales, retail sales, capacity utilization, Manufacturing PMI (below 50), input prices of raw materials RMPI, foreign securities purchases, manufacturing sales
Watch / New Releases:
-
GDP
-
Next Monetary meeting of the Bank of Canada on July 10.
USD
Short USindex trades at 96.11$, 96.43$ and 96.58$,
Strengths of USD – Risk off points:
- pricing the geopolitical risk is the most challenging thing to do. In my book, rising riks is tranlated intto USD strenghtening.
- GDP q/q growth at 3.2%, way higher than the expected 2.1~2.8% range, resilient job market.
- Improving macro readings: retail sales, trade balance, CPI m/m, core PCE, capacity utilization rate, personal spending, unemployment, consumer confidence, optimism, manufacturing Index, housing starts, building permits, industrial production, Non-manufacturing PMI, vehicles sales, consumer credit
Weaknesses of USD –Risk on points:
- as we are exiting the tightening cycle, given the latest FED’s dots, shorting the USD seems the obvious thing to do
- Deteriorating macro readings: GDP, inflation expectations, unit labor cost, current account, PPI, factory orders, durable goods orders, business inventories, wholesale inventories rising, manufacturing PMI, services PMI, consumer sentiment, construction spending, existing home sales, new home sales, home prices
Watch / New Releases:
-
consumer confidence, durable goods orders, trade balance, wholesale inventories, GDP, core PCE (the most watched inflation metric by the FED), consumer sentiment
- next Monetary Meeting of the FED on 31 July. A rate cut is already priced.
EUR
Long EURUSD at 1.1264
Strengths of EURUSD:
- ECB communicated that the prolongation of uncertainty (outcome of US-China trade relations, and outcome of Brexit) made them postpone any potential rate change for another 7 months (rates will remain the same at least through 1H2020). There is no sign of inflation expectations de-anchoring, or a probability of deflation or recession. On the other hand, Draghi admitted that there have been talks on the reintroduction of QE or a rate drop, something that was re-emphasized at the latest ECB’s forum on Central Banking.
- tariffs on autos have been postponed. Nevertheless, the trade relations between the USA and the EU are the next hot issue for 2H19.
- improving macro readings: GDP, unemployment, M3, private loans, German GDP, German Trade balance, German factory orders, wage growth, German Manufacturing PMI (below 50), EU Manufacturing PMI (but below 50),service PMI, consumer confidence, business climate
Weaknesses of EURUSD:
- the Italian drama could produce breaking news once again. Nevertheless, the Italian yields are falling like the rest of the EU government bond yields.
- negative yields are back to stay.
- deteriorating macro readings: inflation, retail sales, current account, trade balance, PPI, German industrial production, German retail sales, German consumer climate, European industrial production, economic sentiment, German economic sentiment,investor confidence
Watch / New Releases:
-
German business climate, inflation
-
Next monetary meeting of the ECB on July 25.
GBP
Short GBPUSD at 1.2934 and 1.2958
Strengths:
- Unemployment fell and is expected to further fall to 3.5% by 2022.
- improving macro releases: rising input prices for retailers, M4, unemployment, industrial production, Service PMI, wages, trade balance, increasing public sector net borrowing, high street lending, mortgage approvals, lending to individuals, construction output
Weaknesses:
- the assumptions made by the BOE, for a smooth Brexit and tightening of monetary policy, become more unlikely to materialize.
- Boris Johnson leads the race for the Conservative party leadership, bringing little hope for productive negotiations with the EU, as the 31st of October deadline is approaching.
- property values predicted to fall by 1,25% within 2019, according to the BOE
- deteriorating macro releases: GDP, inflation, retail sales, consumer inflation expectations, average earnings, consumer’s confidence, current account, Business Investments, Manufacturing PMI (crossed below 50), construction PMI (crossed below 50), manufacturing production, industrial order expectations, home prices
Watch / New Releases:
-
high street lending, home prices, current account, GDP
-
Next Monetary Meeting of the Bank of England on August 1.
Disclaimer
Issued by Labis Michalopoulos, CFA
For the readers of the report:
Redistribution is allowed as long as the author and his contact details are referenced.
This material is for Qualified Investors and Professional Clients only and should not be relied upon by any other person.
Past performance or past accurate forecasts is not a guide to future performance and the accuracy of future forecasts and should not be the sole factor of consideration. All financial investment decisions involve an element of risk.
This report is for information purposes only and does not constitute an offer or invitation to anyone to invest or trade and has not been prepared in connection with any such offer.
Any research in this document has been independently produced by Labis Michalopoulos, CFA for his own purpose. The views expressed do not constitute investment or any other advice and are subject to change. The author has an interest in the currency pairs, indexes and any other security disclosed in this report, as he is an active trader.
Reliance upon information in this material is at the sole discretion of the reader.
Opinions expressed in the report do not represent the opinion of Zulutrade and do not constitute an offer or invitation to anyone to invest or trade.
For qualified perspective clients of the advisory service:
GIPS standards are all about full, fair, consistent and comparable presentation of actual returns of the past. No models, no back-testing, no promises. I am doing that. I am publishing in real time, via a 3rd party, my actual returns since inception where one can see the most strict, comparable, revealing metric of the industry: the monthly Sharpe ratio.
My current monthly Sharpe ratio stands at 0.27 as can be found at www.forexfactory.com/dxmix
My current annual Sharpe ratio is 0.27 multiplied by √12 = 0.27 x 3.46=0.93 Annual Sharpe Ratio
The numbers used to stand at 0.5 monthly Sharpe ratio and 1.73 annual Sharpe ratio up until the August of 2019 for 45 consecutive months. On 24 August 2018, I mistakenly ordered to open a position 10 times bigger that I am used to. My equity level is currently back on track, but my statistics are no longer as impressive as they used to be. My 54 months, since inception, monthly Sharpe Ratio (that includes the leveraged AUDUSD trade) stands at 0.27, equal to 0.93 Annual Sharpe Ratio.
I cannot claim that I will be performing with the return of my best months, but I can tell that I will hover around my average returns. Claiming with a 95% confidence, that my next month* return will be within my average monthly return ± 2 standard deviations is a well educated statement I can make anytime.
My average monthly* return ± 2 standard deviations is from -16.54% up to 20.49%
My average monthly* return ± 2 stadard deviations becomes -5.74% up to 9.47% , excluding the 4 months effect of the one time mistake trade.
* the monthly returns are the actual returns within a month. They are not presented on annualized basis.