


EU sanctions on Turkey, EU tax on US tech giants, Microsoft thrives, Never ending protests in Hong Kong, Additional tensions in the strait of Hormuz
Issued by Labis Michalopoulos, CFA
3+9 minutes read report, 2+6 pages
Editorial:
Taking profits on Tuesday and waiting at the sidelines to re-enter long equities, oil, EUR, AUD, CAD, NZD positions on Monday 22, was the correct thing to do last week. As the never-ending debate on what is really a structural change and what is cyclical continues, I am favoring long USD trades up until Friday.
The possibility of President Trump igniting trade tensions with Europe is still present and rising. The last week French law that taxes US tech giants with 3% on the revenue they generate inside France, has been discussed at the G7 finance ministers summit. The USA responded with starting a years long investigation on France, similar to the investigation they did on China. At the same time, the tension between Japan and South Korea is rising.
Major events of last week:
- US-China: Phone calls between top negotiators of both sides continue, but no face-to-face meeting is being scheduled. President Trump, having TV & Real-Estate mentality, is mainly re-branding and eventually signing deals, was a worth-sharing comment by Mrs. Angeliki Frangou. Ι keep reviewing Huawei, Verizon and Motorola’s market cap, as a proxy of what is going to happen.
Meanwhile, the Chinese space lab Tiangong 2 successfully re-entered the Earth’s atmosphere
- Iran : An iranian drown has been downed by the USA. Two UK vessels have reported being seized by Iran. The Netherland’s Prime Minister has been asked to contribute to the security of the region at a visit he had to the White house.
- Turkey: The USA openly declares that Turkish drilling in Cyprus waters is provocative, and made a step forward canceling the Turkish participation at the F35 program. Remember that by the end of the month, all Turkish pilots trained for the F-35 jets are ordered to leave the USA. EU’s reaction is no longer verbal.
- Japan: Tomorrow, Japan is heading to the polls. Shinzo Abe’s Liberal Democratic Party is set to win 75 out 124 seats. The revision of Article 9 of Japan’s constitution is on the agenda. Article 9 currently forbids Japan from maintaining an army, navy and air force, other than maintaining some forces necessary for self-defense. Yet, it should be noted that Japan is already spending 1% of its GDP on defense. The revision is supported by the USA and is disapproved by China, South Korea and North Korea.
- Japan-South Korea: President Moon has asked President Trump to intervene so that Japan ends restrictions on high-tech materials exported to S. Korea. Japan stopped exporting 3 chemicals to S. Korea. The later started boycotting Japanese products and intend to bring the matter to the WTO. Meanwhile the S.Korean Central Bank has cut rates for the first time in 3 years. The rate stands at 1.50%, S. Korean GDP is expected at 2.0% from 2.8% on 2018.
- Protests: Protests against extraditions to China, in Hong Kong continue for the 7th week. This week an additional pro-China rally is scheduled.
Major events of next week:
- US Earnings season. Tuesday: Coca-Cola, Harley Davinson. Wednesday: Boeing, Ford. Thursday: Amazon, Google. Friday: Twitter
- NATO summit in Brussels
- Gas Forum in Cairo on Wednesday and Thursday
- ECB’s monetary meeting on Thursday
JPY
Short EURJPY at 121.84
Strengths of JPY:

- Sunday’s elections
- improving macro readings: GDP, retail sales, trade balance, unemployment, household spending, monetary base, capital spending, economy watchers sentiment, consumer sentiment
Weaknesses of JPY:
- tensions with S. Korea
- economy needs to overcome the upcoming consumption tax hike, scheduled to be imposed on October.
- deteriorating macro readings: inflation, current account, manufacturing PMI (below 50), machine orders,industries activity, insdustrial production, Services PMI, M2, average cash earnings, bank lending, consumer confidence, PPI(prices sold to corporations), housing starts, consumer confidence,
Watch / New Releases:
-
inflation
-
next Monetary Meeting of the Bank of Japan on 30 July.
AUD
Long AUDUSD at 0.6938
Strengths:

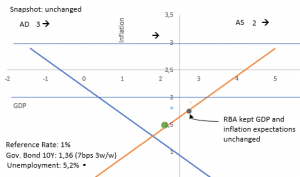
- Markets approved the monetary accommodating decision of the RBA to cut rates for a second time in 2019. The RBA is confident on a 2H19 rebound.
- improving macro readings: GDP, retail sales, trade balance, current account, job advertisements, M1, home loans, service PMI, Manufacturing PMI, AIG construction index, construction work done (but is still in a negative territory), household consumption, wage price index, new home sales, building approvals, business confidence
Weaknesses:
- deteriorating macro readings: inflation gauge, private sector credit, AIG manufacturing index, AIG services index, HPI (home prices), company operating profits, decreasing capital expenditure, private capital expediture, consumer’s sentiment
Watch / New Releases:
-
Flash manufacturing and service PMI
-
Next monetary meeting of the RBA on August 6. Two rate cuts have been decided so far in 2019.
CAD
Long USDCAD at 1.2996
Strengths of CAD:

- the ongoing geopolitical tensions in the Persian gulf
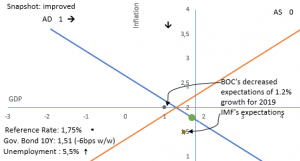
- housing market is expected to pick up in 2H19, following the stabilization in Toronto and Vancouver.
- improving macro readings: trade balance, labor productivity, Ivey PMI, wholesale sales, employment change, housing starts, manufacturing sales, corporate profits, foreign securities purchases
Weakness of CAD:
- the USA is expanding its exports of LNG and price competition intensifies.
- fiscal policy expected to have a -0.2% net effect in GDP growth.
- weak government until the upcoming elections on October.
- deteriorating macro readings: GDP, current account, retail sales, inflation, unemployment, capacity utilization, Manufacturing PMI (below 50), input prices of raw materials RMPI, foreign securities purchases, building permits, home prices
Watch / New Releases:
-
Wholesale sales
-
Next Monetary meeting of the Bank of Canada on September 4.
USD
Long USindex trades at 96.12$

Strengths of USD:
- Improving macro readings: GDP (stable), retail sales(stable), wholesale inventories (stable), trade balance, inflation, core PCE(stable), personal income(stable), unemployment, non-farm payrolls, durable goods orders, manufacturing PMI, Non-manufacturing PMI, services PMI, vehicles sales(stable), consumer credit, home prices, housing starts, consumer sentiment, consumer confidence, economic optimism
Weaknesses of USD –Risk on points:
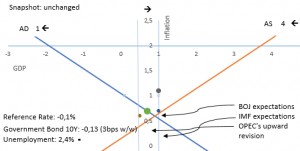
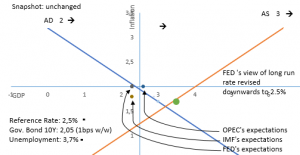
- a rate cut on the 31st of July is already priced in the markets. On the other hand, I am expecting that the FED would communicate that the rate cut is not meant to be the beginning of an easing cycle, but it is a move to balance risks.
- Deteriorating macro readings: current account, inflation expectations,capacity utilization rate, unit labor cost, personal spending, PPI, factory orders, industrial production, manufacturing Index, construction spending, existing home sales, new home sales,building permits
Watch / New Releases:
-
Manufacturing PMI, service PMI, GDP q/q
- next Monetary Meeting of the FED on 31 July. A rate cut is already priced.
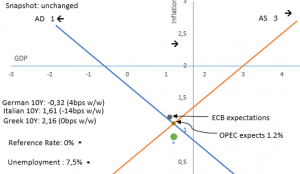
EUR
Short EURUSD at 1.1428
Strengths of EURUSD:

- Greek economy may soon get rid of the capital controls imposed since the summer of 2015. Yet, the rating of Greek debt is having a stable outlook, which means that no upgrade is expected for the next 12~18 months.
- ECB communicated that the prolongation of uncertainty (outcome of US-China trade relations, and outcome of Brexit) made them postpone any potential rate change for another 7 months (rates will remain the same at least through 1H2020). There is no sign of inflation expectations de-anchoring, or a probability of deflation or recession. On the other hand, Draghi admitted that there have been talks on the reintroduction of QE or a rate drop, something that was re-emphasized at the latest ECB’s forum on Central Banking.
- tariffs on autos have been postponed. Nevertheless, the trade relation between the USA and the EU is the next hot issue for 2H19. The French tax on tech giants increases this tension.
- improving macro readings: GDP, unemployment, M3, private loans(stable), trade balance, German GDP, German Trade balance, German factory orders, wage growth, EU Manufacturing PMI (but below 50), European industrial production, service PMI
Weaknesses of EURUSD:
- the Italian drama could produce breaking news once again. Nevertheless, the Italian yields are falling like the rest of the EU government bond yields.
- negative yields are back to stay.
- deteriorating macro readings: inflation(stable), retail sales, current account, PPI, German Manufacturing PMI (below 50), economic sentiment, German economic sentiment,investor confidence
Watch / New Releases:
-
Manufacturing and Services PMI, private loans
-
Thursday’s monetary meeting of the ECB.
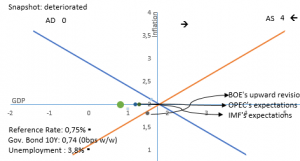
GBP
Short GBPUSD at 1.2645
Strengths:
- Unemployment fell and is expected to further fall to 3.5% by 2022.
- improving macro releases: GDP, retail sales, rising input prices for retailers, home prices, unemployment, average earnings, wages, trade balance, increasing public sector net borrowing, mortgage approvals, lending to individuals, construction output
Weaknesses:
- the Switzerland-EU dispute acts as a prova-generalle for an upcoming UK-EU dispute
- the UK fiscal watchdog, an organization that uses the same, not efficient macro models like the IMF, is expecting a -3% recession at the event of a no-deal Brexit.
- the assumptions made by the BOE, for a smooth Brexit and tightening of monetary policy, become more unlikely to materialize.
- Boris Johnson leads the race for the Conservative party leadership, bringing little hope for productive negotiations with the EU, as the 31st of October deadline is approaching.
- property values predicted to fall by 1,25% within 2019, according to the BOE
- deteriorating macro releases: current account, inflation (stable), consumer inflation expectations, M4, Business Investments, high street lending, Manufacturing PMI (below 50), construction PMI (way below 50), industrial order expectations, Service PMI, consumer confidence
Watch / New Releases:
-
new Conservative party leader will be announced
-
high street lending
-
Next Monetary Meeting of the Bank of England on August 1.
Disclaimer
Issued by Labis Michalopoulos, CFA
For the readers of the report:
Redistribution is allowed as long as the author and his contact details are referenced.
This material is for Qualified Investors and Professional Clients only and should not be relied upon by any other person.
Past performance or past accurate forecasts is not a guide to future performance and the accuracy of future forecasts and should not be the sole factor of consideration. All financial investment decisions involve an element of risk.
This report is for information purposes only and does not constitute an offer or invitation to anyone to invest or trade and has not been prepared in connection with any such offer.
Any research in this document has been independently produced by Labis Michalopoulos, CFA for his own purpose, and is intentionally written in first person. The views expressed do not constitute investment or any other advice and are subject to change. The author has an interest in the currency pairs, indexes and any other security disclosed in this report, as he is an active trader.
Reliance upon information in this material is at the sole discretion of the reader.
Opinions expressed in the report do not represent the opinion of Zulutrade, XM or any other company that is being advertised and do not constitute an offer or invitation to anyone to invest or trade.
For qualified perspective clients of the advisory service:
GIPS standards are all about full, fair, consistent and comparable presentation of actual returns of the past. No models, no back-testing, no promises. I am doing that. I am publishing in real time, via a 3rd party, my actual returns since inception where one can see the most strict, comparable, revealing metric of the industry: the monthly Sharpe ratio.
My current monthly Sharpe ratio stands at 0.27 as can be found at www.forexfactory.com/dxmix
My current annual Sharpe ratio is 0.27 multiplied by √12 = 0.27 x 3.46=0.93 Annual Sharpe Ratio
The numbers used to stand at 0.5 monthly Sharpe ratio and 1.73 annual Sharpe ratio up until the August of 2019 for 45 consecutive months. On 24 August 2018, I mistakenly ordered to open a position 10 times bigger that I am used to. My equity level is currently back on track, but my statistics are no longer as impressive as they used to be. My 54 months, since inception, monthly Sharpe Ratio (that includes the leveraged AUDUSD trade) stands at 0.27, equal to 0.93 Annual Sharpe Ratio.
I cannot claim that I will be performing with the return of my best months, but I can tell that I will hover around my average returns. Claiming with a 95% confidence, that my next month* return will be within my average monthly return ± 2 standard deviations is a well educated statement I can make anytime.
My average monthly* return ± 2 standard deviations is from -16.54% up to 20.49%
My average monthly* return ± 2 stadard deviations becomes -5.74% up to 9.47% , excluding the 4 months effect of the one-time mistake trade.
* the monthly returns are the actual returns within a month. They are not presented on annualized basis.