


Report for 11-15 March, Issue 57
Adding Accommodation
10 minutes read report, 9 pages
To help speed reading blue is used for new arguments, forecasts are underlined and found at the beginning of each page.
How the forecasts did:
For the second week in a row, my forecasts fared. Short EURJPY and long USDCAD were not triggered. The short USD index, long EURUSD and long AUDUSD trades are in the red.
Major events of last week:
-
China: GDP target was set at 6~6.5%. More tax cuts to boost the manufacturing sector are in the pipeline.
-
USA: Trump plans to end the preferential trade treatment for India and Turkey. Turkey would proceed with the purchase of the S-400 missiles from Russia and could be excluded from the American F-35 fighter jet program.
-
USA-North Korea: South Korea and the USA agreed to reduce their joint military exercises.
-
China-Taiwan: Taiwan has made a formal request to the United States for new fighter jets to defend itself against increasing Chinese threats.
-
Russia-Ukraine: Europeans do not want to increase pressure against Russia.
-
Cryptos: Total market cap at $133bn, +2.0% w/w, -84% from last year’s $821bn peak.
Major events of next week:
-
Tuesday’s possible UK Parliament vote.
-
CERA week, the World’s most important Energy Event. I would short Brent at $65.30
-
OPEC’s report on Thursday.
-
Bank of Japan is having it’s monetary meeting on Friday.
JPY
No forecasts for EURJPY
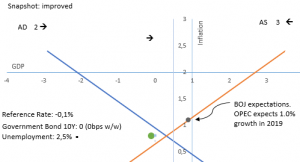

Strengths of JPY:
-
GDP q/q growth rebounded from the negative territory.
-
improving macro readings: GDP (yet, it is expected to decrease in 2019), inflation, current account, average cash earnings, household spending,capital spending, industries activity, economic sentiment
Weaknesses of JPY:
-
deteriorating macro readings: unemployment, retail sales,Services PMI, manufacturing PMI, industrial production, housing starts, M2, trade balance, monetary base, bank lending, sentiment reading
Watch / New Releases:
-
M2
-
Friday’s Monetary Meeting
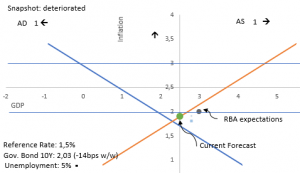
AUD
Keep the long AUDUSD trades from 0.7038

Strengths:
-
improving macro readings: retail sales, current account, trade balance, inflation, inflation expectations, unemployment, M1, private capital expenditure, AIG manufacturing index, household consumption recovered in 3Q18, wage price index, consumer’s sentiment, business confidence, building approvals
Weaknesses:
-
GDP latest reading was unexpectedly lower.
-
China reported very low imports (-5.7%m/m) and exports (-20%)
-
Westpac, one of the top four Australian banks, is expecting two rate cuts, in August and November 2019. Moreover it lowered it’s GDP expectations to 2.4%y/y from 2.7%
-
deteriorating macro readings: GDP, inflation gauge, job advertisements, manufacturing PMI, service PMI, home sales, home loans,company operating profits, decreasing capital expenditure, construction work done, private sector credit
Watch / New Releases:
-
home loans, business confidence, consumer sentiment
-
Next monetary policy meeting on April 2.
CAD
Favoring of long USDCAD trades


Strengths of CAD:
-
the 1.3505 USDCAD level may act as a resistance and pause the uptrend.
-
improving macro readings: employment change, inflation, current account, wholesale sales, retail sales (latest release was higher but it is still negative)
Weakness of CAD:
-
Prime Minister is loosing political capital due to his involvement in helping the big contractor, SNC-Lavalin, to avoid criminal prosecution related to contracts in Libya. Jane Philpott, the treasury board president, resigned, following the resignations of Gerald Butts, Prime Minister Justin Trudeau’s former top adviser, and the resignation of Wilson-Raybould, Minister of Veterans.
-
The upcoming CERA week and Thursday’s monthly report of OPEC could send oil prices lower
-
deteriorating macro readings: GDP, labor productivity, trade balance, capacity utilization, Manufacturing PMI, manufacturing sales, Ivey PMI, corporate profits,foreign securities purchases, building permits
Watch / New Releases:
-
CERA week and Thursday’s OPEC report
-
Manufacturing sales
-
Next monetary meeting on April 24.
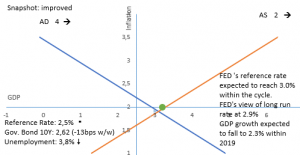
USD
Exit the short USDindex trades from 0.9683

Strengths of USD – Risk off points:
-
Geopolitical risk in Turkey, Afghanistan, Taiwan seem to be falling. Yet there is ongoing tension between Pakistan and India.
-
The latest unit labor cost, average hourly earnings and unemployment readings indicate that inflationary pressures are present.
-
deteriorating macro readings: GDP, current account, retail sales, wholesale inventories moving higher, Manufacturing PMI, Non-manufacturing PMI, industrial production, consumer credit, optimism, consumer credit, personal spending, vehicles sales
Weaknesses of USD -Risk on points
-
Improving macro readings: unemployment, unit labor cost, trade balance, Manufacturing Index,services PMI, durable goods orders, capacity utilization rate, consumer confidence, construction spending, moving lower, housing market, home sales
Watch / New Releases:
-
retail sales, business inventories, inflation, durable goods orders, capacity utilization rate, consumer sentiment
-
next Monetary Meeting on 20 March. No hike is expected.
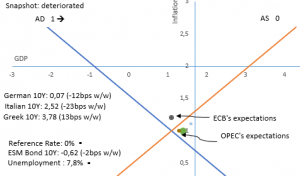
EUR
I keep the long EURUSD trades from 1.1278
Politics aside (Spain’s elections on April 28 and European election on May 26) wage growth, Italian growth and the German car industry are the decisive factors that drive the European outlook.
The ECB surprised markets by introducing a new TLTRO program that will begin in September 2019 and by changing its forward guidance and eliminating any thoughts for a first rate hike later than December 2019. There were board members favoring a March 2020 communication.

Strengths of EURUSD:
-
improving macro readings: trade balance, current account, retail sales, unemployment, Services PMI, Manufacturing PMI (below 50),German GDP, German Trade balance, wage growth, industrial production, economic sentiment, private loans
Weaknesses of EURUSD:
-
EU-USA trade relations will be the next point of focus. The Trump administration wants to include agriculture in the negotiations, the EU is willing to limit negotiations to industrial goods, as it was agreed in the July’s Junker-Trump summit. Additionally, the EU wants the steel and aluminum tariffs to be removed.
-
downward revisions of expected GDP growth from European commission (1.3% EU growth from 1.9% expected in November) and from the ECB (1.1% revised from 1.7%)
-
deteriorating macro readings: inflation, M3, PPI, investor confidence,consumer confidence, German factory orders, German industrial production, German retail sales
Watch / New Releases:
-
German trade balance,industrial production,inflation
-
Next monetary meeting of the ECB on April 10
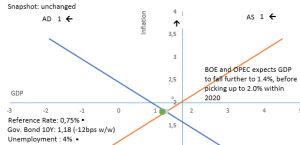
GBP
No forecasts for GBP
We are only 3 weeks away from the deadline of Article 50 and the most probable scenario is the extension of the deadline, new elections and/or a new referendum. EU is considering an extension up to January 2021 while the UK Parliament is having a new vote on Tuesday 12th of March.

Strengths:
-
improving macro releases: unemployment, Service PMI,Manufacturing production, industrial order expectations, average earnings and wages, decreased inflation, lending to individuals, trade balance
Weaknesses:
-
GDP growth has slowed further. Some inflationary pressure was expected by BOE that would be responded with limited rate hikes, but inflation has already fallen below the 2.0% target.
-
the ongoing uncertainty is already evident at macro readings, and could drag on until July. Investments have been hit the most. Latest GDP m/m reading was negative, business and consumer confidence drop to a seven year low.
-
deteriorating macro releases: GDP, retail sales, M4, home prices, consumer’s confidence, current account, Business Investments, Construction PMI (below 50), construction output, Manufacturing PMI, Industrial production
Watch / New Releases:
-
Consumer Inflation Expectations, GDP, Industrial and manufacturing production
-
Next monetary meeting on 21 March
Appendix
The blue line represents the aggregate demand curve of the economy (not the demand for the currency of the economy) and red line represents the aggregate supply curve.
The lines intersect at the latest published GDP growth and latest published inflation rate. The blue dots represent past snapshots of the economy (ie past GPD growth and past inflation). The green dot represents the estimated GDP growth and inflation. In the above example, the estimated economic equilibrium is the same with the current equilibrium.
The horizontal line is the targeted level of inflation so that long term growth is achieved. The vertical line represents long term potential growth. In the above example, the potential growth is within the range of 0.5% and1.0%. Targeted inflation is 2%. The economy is growing below its potential and with lower inflation.
The arrows represent the effects of the latest macro releases.
Disclaimer
Issued by Labis Michalopoulos, CFA
Redistribution is allowed as long as the author and his contact details are referenced.
My net returns are published in real time at www.forexfactory.com/dxmix I was experiencing an Annual Sharpe Ratio of 1.73 for over 45 months (montly Sharpe ratio above 0.5) . On 24 August, I mistakenly ordered to open a position 10 times bigger that I am used to. My equity level is currently back on track, but my statistics are no longer impressive. My 48 months monthly Sharpe Ratio, that includes the leveraged AUDUSD trade, now stands at 0.30, equal to 1.03 Annual Sharpe Ratio.
This material is for Qualified Investors and Professional Clients only and should not be relied upon by any other person.
Past performance or past accurate forecasts is not a guide to future performance and the accuracy of future forecasts and should not be the sole factor of consideration. All financial investments involve an element of risk.
This report is for information purposes only and does not constitute an offer or invitation to anyone to invest or trade and has not been prepared in connection with any such offer.
Any research in this document has been independently produced by Labis Michalopoulos, CFA for his own purpose. The views expressed do not constitute investment or any other advice and are subject to change. The author has an interest in the currency pairs, indexes and any other security disclosed in this report as he is an active trader.
Reliance upon information in this material is at the sole discretion of the reader.