12 minutes read report, 9 pages
How the forecasts did:
Last week’s forecasts were poor. The targeted exit level of AUDUSD was missed by 15pips, short USD and long EURUSD trades were not triggered. On the other hand, USDCAD moved north and the advised exit level of the EUJPY trade can be filed positively.
Major events of last week:
- USA-China: The extension of the trade truce had no deadline.
- USA and National Emergency: Democrats passed a resolution blocking Trump from accessing the $5.7bn funds to build his wall.
- USA-North Korea: No deal has been reached on complete, verifiable and irreversible de-nuclearization of N.Korea, at the latest Trump-Kim summit, that happened in Vietnam.
- Pakistan-India: Following a suicide bombing in Kashmir on 14Feb a crisis between Pakistan and India escalated. On 24Feb 5 people were killed in a gunfight, on 25Feb Indian Police and Troops cut-off neighborhoods, on 27 Feb it has been reported that both Pakistan and India have lost one aircraft jet each. On Friday 1 March Pakistan announced that they would release the captured pilot as a peace gesture. Meanwhile, on Wednesday the foreign ministers of India, China and Russia met. Kashmir region is controlled by India (43% of the land), Pakistan (37% of the land) and China (20% of the land).
- Turkey: Turkey performed it’s largest ever naval exercises with the simultaneous participation of 100 ships operating across the Black Sea, the Aegean Sea and eastern Mediterranean
- China-Taiwan:Two U.S. Navy ships passed through the Taiwan Strait during the week
- Russia-Ukraine: Ukrainian elections are scheduled on 31st of March.
- Venezuela: Both the USA’s and Russian resolution plans for Venezuela were rejected in the UN. Russia and China vetoed the USA plan, the USA, EU and Peru vetoed the Russian plan. Venezuela is due to make a $100million payment to it’s bond holders.
- UK: News agencies are starting to favor the extension of the deadline scenario.
- Cryptos: Total market cap at $130bn, -3.7% w/w, -84% from last year’s $821bn peak.
Major events of next week:
- Bank of Canada (Tuesday), Central Bank of Australia (Wednesday) and ECB (Thursday) are having a monetarty meeting
- Wednesday’s meeting of 72 countries, including the USA, the EU countries and China to discuss on e-commerce. On the same day, Mrs. Marlstrom, EU’s trade commissioner, and Mr. Lighthizer, US trade negotiator will have a new round of negotiations.
- March includes the upcoming CERA week, the World’s most important Energy Event, the Turkish elections, the expected conclusion of the investigation on Russian intervention at the US presidential elections, Ukrainian elections.
JPY
Short EURJPY trades at 128.10

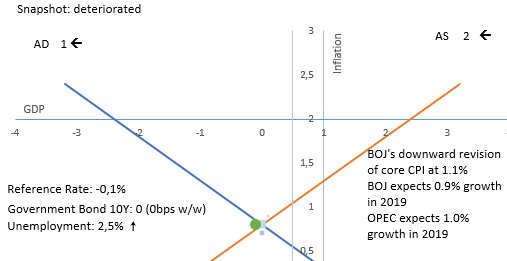
Strengths of JPY:
- GDP q/q growth rebounded from the negative territory.
- improving macro readings: GDP (yet, it is expected to decrease in 2019), inflation, current account, average cash earnings, household spending, bank lending,capital spending, industries activity
Weaknesses of JPY:
- deteriorating macro readings: unemployment, retail sales,Services PMI, manufacturing PMI, industrial production, housing starts, M2, trade balance, monetary base, sentiment reading
Watch / New Releases:
- Monetary base, bank lending, household spending, current account, GDPq/q,economic sentiment
- Next Monetary Meeting on 15 March
AUD
Long AUDUSD trades at 0.7038

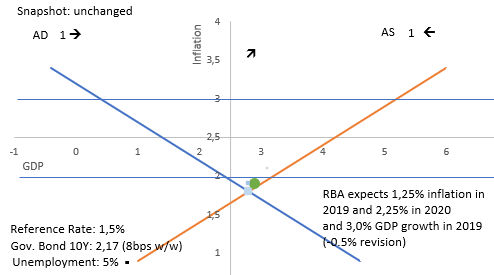
Strengths:
- Last Thursday a Chinese port halted Australian coal from being imported, sending AUD lower. Markets have mispriced the event as it was initially perceived as a Chinese retaliation move against the Australian Huawei ban. Further AUD upside is expected
- improving macro readings: GDP, trade balance, inflation, inflation expectations, unemployment, M1, private capital expenditure, AIG manufacturing index, household consumption recovered in 3Q18, wage price index, consumer’s sentiment, business confidence
Weaknesses:
- Westpac, one of the top four Australian banks, is expecting two rate cuts, in August and November 2019. Moreover it lowered it’s GDP expectations to 0.2%q/q from 0.5% and 2.4%y/y from 2.7%
- The governor of the Central Bank (RBA) communicated balanced probabilities for a rate hike or rate cut. New insights are expected this week.
- China’s impressive increase of new loans, was not coupled with an increase of PMI numbers
- deteriorating macro readings: retail sales, inflation gauge, job advertisements, manufacturing PMI, service PMI, home sales, home loans, current account,company operating profits,decreasing capital expenditure, building approvals, construction work done, private sector credit
Watch / New Releases:
- Building approvals, company operating profits,current account, GDP q/q, retail sales, trade balance
- Tuesday’s monetary policy meeting.
CAD
Long USDCAD at 1.3207.

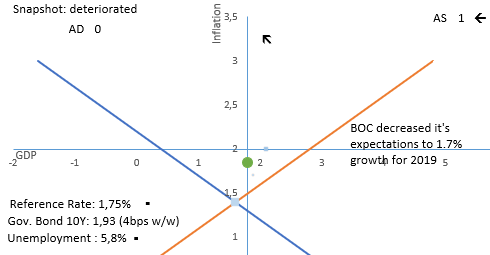
Strengths of CAD:
- improving macro readings: employment change, inflation, current account, building permits, wholesale sales, retail sales (latest release was higher but it is still negative)
Weakness of CAD:
- Prime Minister is loosing political capital due to his involvement to help the big contractor, SNC-Lavalin, avoid criminal prosecution
- OPEC’s February report on the oil market, included another downward revision of the global oil demand growth. (1.29Mb/day increase, was revised to 1.24Mb/day increase) so that by the end of 2019 World would consume the round number of 100MB/day. CERA week begins on March 11.
- deteriorating macro readings: GDP, unemployment, trade balance, Manufacturing PMI, manufacturing sales, Ivey PMI, corporate profits,foreign securities purchases
Watch / New Releases:
- Trade balance, building permits, unemployment rate, capacity utilization rate
- Wednesday’s monetary meeting. The latest macro releases do not favor the rate hike scenario I was supporting during the previous weeks.
USD
Short USDindex at 0.9683

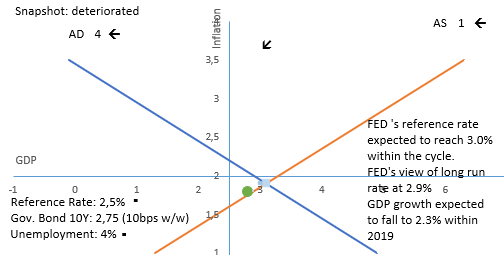
Strengths of USD – Risk off points:
- Geopolitical risk in Turkey, Afghanistan, Taiwan seem to be falling. Yet there is ongoing tension between Pakistan and India.
- deteriorating macro readings: GDP, current account, retail sales, wholesale inventories moving higher, Manufacturing PMI, Non-manufacturing PMI, industrial production, consumer credit, optimism, consumer credit, personal spending, vehicles sales
Weaknesses of USD -Risk on points
- FED changed it’s communication and is currently on hold as there is zero inflationary pressure. Both Inflation expectations and capacity utilization rates are falling.
- Improving macro readings: trade balance, Manufacturing Index,services PMI, durable goods orders, capacity utilization rate, consumer confidence, construction spending, moving lower, housing market, home sales
Watch / New Releases:
- Services PMI, Non-manufacturing PMI, home sales, trade balance, consumer credit, unemployment rate,
- next Monetary Meeting on 20 March. No hike is expected.
EUR
Long EURUSD at 1.1278
Strengths of EURUSD:
- EU denied the release of the latest €750million funds toward Greece, as the promished reforms had not materialized.

- Markets are pricing rising political risk ahead of Spain’s snap elections on April 28 and the European Parliament Elections in May. My conviction is that the results of both elections will eventually trigger a EUR rally, the same way that EUR rallied following the French elections of 2017. The European Barometer survey reveals a significant rise of the positive views of Europeans, towards the EUR currency. The quick fall of the 5 Star Movement in the Italian polls is an additional argument.
- The bond yields of European periphery are decreasing
- improving macro readings: trade balance, current account, unemployment, Services PMI, Manufacturing PMI (bellow 50),German GDP, German Trade balance, wage growth, industrial production, economic sentiment, private loans
Weaknesses of EURUSD:
- EU-USA trade relations will be the next point of focus. The list of hot topics includes: different stances on Iran nuclear deal, threat of imposing tariffs on EU automobile industry, imposed tariffs on European steel & aluminum, imposed tariffs on American motor cycles and oranges. EU trade commissioner, Malstorm, will meet Lighthizer on Wednesday.
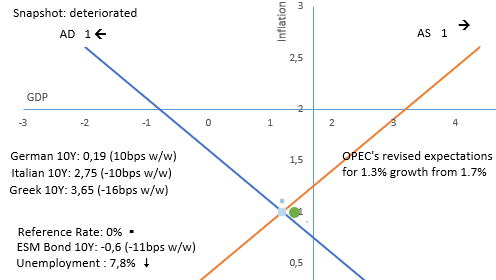
- downward revisions of expected GDP growth from European commission. 1.3% EU growth from 1.9% expected in November, 0.2% Italian growth from 1.2%. Inflation revised to 1.4% from 1.8%
- markets are projecting at least another 2-3 years of re-investment of maturing securities and the first rate hike in 2020
- The German and the Italian economy have reported negative GDP q/q growth. Germany managed to avoid the technical recession as the latest published GDP q/q growth was 0.0%
- Worsening relations between France and Italy over the ‘gilets jaunes’ and immigration
- deteriorating macro readings: GDP, inflation, M3, PPI, retail sales, investor confidence,consumer confidence, German factory orders, German industrial production, German retail sales
Watch / New Releases:
- Service PMI, Retail sales, GDP q/q
- Thursday’s monetary meeting of the ECB.
GBP
No forecasts for GBP
We are only 4 weeks away from the deadline of Article 50 and the most probable scenario is the extension of the deadline, new elections and/or a new referendum. EU is considering an extension up to January 2021 while the UK Parliament is having a new vote on the 12th of March

Strengths:
- improving macro releases: unemployment, retail sales, Manufacturing production, industrial order expectations, average earnings and wages, decreased inflation, lending to individuals, trade balance
Weaknesses:
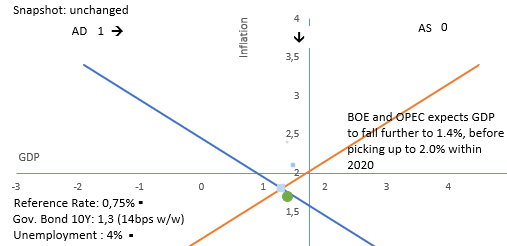
- GDP growth has slowed further. Some inflationary pressure was expected by BOE that would be responded with limited rate hikes, but inflation has already fallen below the 2.0% target.
- the ongoing uncertainty is already evident at macro readings, and could drag on until July. Investments have been hit the most. Latest GDP m/m reading was negative, business and consumer confidence drop to a seven year low.
- deteriorating macro releases: GDP, M4, home prices, Service PMI, consumer’s confidence, current account, Business Investments, Construction PMI, construction output, Manufacturing PMI, Industrial production
Watch / New Releases:
- Construction PMI, Services PMI, Consumer Inflation Expectations
- Next monetary meeting on 21 March
Appendix
The blue line represents the aggregate demand curve of the economy (not the demand for the currency of the economy) and red line represents the aggregate supply curve.
The lines intersect at the latest published GDP growth and latest published inflation rate. The blue dots represent past snapshots of the economy (ie past GPD growth and past inflation). The green dot represents the estimated GDP growth and inflation. In the above example, the estimated economic equilibrium is the same with the current equilibrium.
The horizontal line is the targeted level of inflation so that long term growth is achieved. The vertical line represents long term potential growth. In the above example, the potential growth is within the range of 0.5% and1.0%. Targeted inflation is 2%. The economy is growing below its potential and with lower inflation.
The arrows represent the effects of the latest macro releases.
Disclaimer
Issued by Labis Michalopoulos, CFA
https://quantomental.com
https://dxml.wordpress.com/
Redistribution is allowed as long as the author and his contact details are referenced.
My net returns are published in real time at www.forexfactory.com/dxmix I was experiencing an Annual Sharpe Ratio of 1.73 for over 45 months (montly Sharpe ratio above 0.5) . On 24 August, I mistakenly ordered to open a position 10 times bigger that I am used to. My equity level is currently back on track, but my statistics are no longer impressive. My 48 months monthly Sharpe Ratio, that includes the leveraged AUDUSD trade, now stands at 0.30, equal to 1.03 Annual Sharpe Ratio.
This material is for Qualified Investors and Professional Clients only and should not be relied upon by any other person.
Past performance or past accurate forecasts is not a guide to future performance and the accuracy of future forecasts and should not be the sole factor of consideration. All financial investments involve an element of risk.
This report is for information purposes only and does not constitute an offer or invitation to anyone to invest or trade and has not been prepared in connection with any such offer.
Any research in this document has been independently produced by Labis Michalopoulos, CFA for his own purpose. The views expressed do not constitute investment or any other advice and are subject to change. The author has an interest in the currency pairs, indexes and any other security disclosed in this report as he is an active trader.
Reliance upon information in this material is at the sole discretion of the reader.
This week’s report has been sponsored by XM.com a trade mark of Trading Point Holdings Ltd, that owns Trading Point of Financial Instruments Ltd. Opinions expressed in the report do not represent the opinion of XM and do not constitute an offer or invitation to anyone to invest or trade.